Handout: Production Possibility Frontiers
25th August 2015

Production Possibility Frontiers
Eternal Economic Truth: in the long run productivity (output per person) is almost the only thing that matters for a country’s material well-being. Productivity growth is what the UK economy currently lacks – and if it can happen it shifts the PPF outwards without the need to boost the country’s supply of land, labour or capital.
Over a period of time, resources are scarce and therefore only a finite amount can be purchased. For example, an economy might have enough resources (Land, Labour, Capital) to produce 30 units of manufactured goods and 30 units of non-manufactured goods. If we wanted to produce greater amounts of manufactured goods then we would have to reduce our production of non- manufactured goods. This is because the opportunity cost of producing manufactured goods is the production of non-manufactured goods: for more manufactured goods produced, less non-manufactured can be produced.
In figure 1, a PRODUCTION POSSIBILITY FRONTIER (PPF) is depicted, also known as a Production Possibility Curve, or Transformation Curve.
The PPF shows the different combinations of economic goods which an economy can produce if all economic resources are fully and efficiently employed.
The economy might be at:
The economy might be at:
- Point C, and produce 30 units of manufactured goods and 30 units of non-manufactured goods.
- Point D, producing 35 units of manufactured goods and 20 units of non-manufactured goods.
- Point A, devoting all of its resources to the production of non-manufactured goods, producing 50 units of non-manufactured.
- Points B or E or any other point along the PPF .
-
 Figure One: Production Possibility Frontier
The production possibility frontier illustrates the concept of opportunity cost. Assume that the economy is operating at the point C in Figure 1. If the government desires the economy to shift from the point C to D, this will result in an increase in the production of manufactured goods from 30 to 35. However the opportunity cost (i.e. what must be given up) of such a change is the lost output of non-manufactured goods, falling from 30 to 20. Thus the opportunity cost of increasing the output of manufactureds by 5 is the loss of 10 non-manufactured goods.
The production possibility frontier for an economy is drawn on the assumption that all resources in the economy are fully and efficiently employed. If there are unemployed workers, resources, idle factories or if production is inefficiently organised, then the economy cannot be producing on its PPF. It will produce within the boundary. In figure 1, the economy could produce anywhere along the line A-E. However there is unemployment in the economy, so production is at the point F.
The economy cannot be at any point outside its existing PPF because the PPF, by definition, shows the maximum production level of the economy. However it might be able to move to the right of its PPF in the future if there is economic growth. An increase in the productive potential of an economy is shown by shift outwards of the PPF.

In figure 2 above economic growth pushes the PPF from PP1 to PP2, allowing the economy to increase its maximum level of production say from A to B. Growth in the economy can happen as a result of:
- The quantity of resources available for production increases; for instance there might be an increase in the number of workers in the economy (Labour) or new factories or offices might be built (Capital).
- There is an increase in the quality of resources available in the economy. Education will make workers more productive whilst technical progress will allow machines and production processes to produce more with the same amount of resources.
Production Possibility frontiers are drawn concave to the origin as in Figures 1 and 2. This is because it has been assumed that not all resources in the economy are as productive in one use compared to another.
For example, land may be better suited to the production of one crop rather than another. In Wales relatively little wheat is grown compared to East Anglia because the soil is less suited and therefore less productive when employed in this fashion. If land in Wales is used to grow wheat then output per acre will fall so compared to the average output when only using productive land. Similarly there is an opportunity cost for using the land in Wales. This will include a reduction in for example sheep rearing. In other words the more land used for wheat growing the less land available for sheep rearing.

In Figure 3 only sheep and wheat are produced in the economy. If no wheat is produced, the economy can produce OC of sheep. However, if one unit of wheat is produced, then wheat production falls by BC to OB. Thus the opportunity cost of 1 unit of wheat is BC sheep. The second unit of wheat has a much higher opportunity cost, A-B. If the economy were to only produce wheat then the opportunity cost would rise to OA sheep.
The production possibility frontier by itself doesn’t show which combination of goods will be produced, but in reality only shows the maximum combination of goods an economy could produce given a fixed amount of resources. It shows a range of possibilities, and allows economists to try and explain why an economy might choose to produce at one point and not another on its PPF.
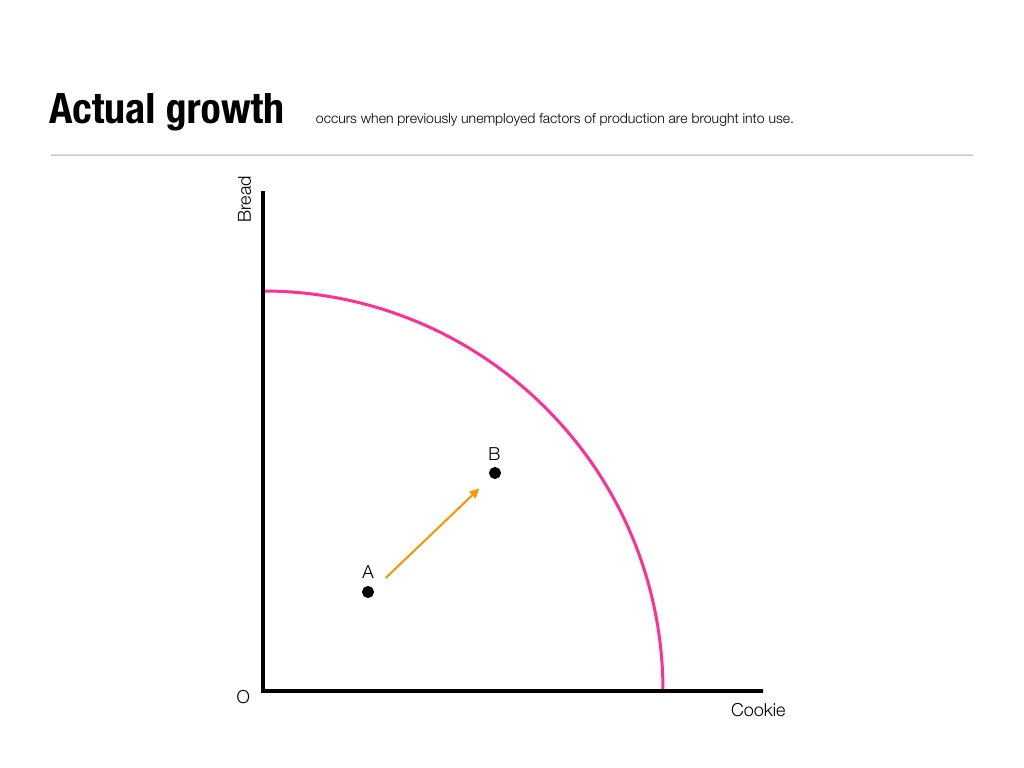
The PPF can demonstrate actual growth in two ways
If the UK economy grows at 2.5% in 2015, this represents an outwards movement from point A to B below. But notice that the economy can also grow at full employment – by investment in new capital, by immigration or by improved factor productivity (paying workers more may cause them to work r harder and more effectively). So the PPF shows two possible growth scenarios.
- Growth towards full employment as represented by a movement from A to B below.
- Growth by either an increase in resources available, or an improvement in factor productivity (Land, Labour, Capital) which will result in the whole frontier shifting outwards.
Confusion to Avoid
Sometimes students make the mistake of describing a movement along a PPF as evidence of the law of diminishing returns. But this cannot be so – diminishing returns is something that happens when variable quantities of one or more factors are added to one fixed factor (typically, variable amounts of labour are added to a fixed stock of capital). Diminishing returns is therefore a short run law (where the short run is defined as that period in which at least one factor is fixed and cannot change).
But the PPF shows possibilities that exist when all factors are variable – indeed it is the possibility of varying the factors up to full employment (at unchanged productivity of factors) that defines the limit of the frontier. Anything beyond that is simply impossible without technical change or migration or something that changes the quantities of factors available.
So a PPF demonstrates increasing opportunity cost (not diminishing returns).
Test yourself:
- How does a PPF demonstrate increasing opportunity cost?
- One of our eternal economic principles goes like this: Eternal Economic Truth: in the long run productivity (output per person) is almost the only thing that matters for a country’s material well-being. Productivity growth is what the UK economy currently lacks – and if it can happen it shifts the PPF outwards without the need to boost the country’s supply of land, labour or capital. Can you explain this?
- How can a PPF be used to explain Britain’s economic performance in 2015?
0 Comments