Handout: The Labour Market
21st October 2016

Handout: The Labour Market – Individual and Market Demand and Supply
source (adapted)
Key issues
- What influences a firm’s demand for labour?
- What influences the workers decision to supply labour?
- What are the main effects on the price elasticity of demand and supply of labour (the responsiveness of each to a change on the wage)?
- What are the effects of a rise in the minimum wage from its present (2016) rate of £7.20 for over 25s, to £10 by 2020, on unemployment?
- What are the economic effects of zero hour contracts?
Derived Demand for Labour
Here we model the labour market in a developed economy – as we model the goods, money and foreign exchange markets.
First, we note that the marginal product of labour (MPL) declines as employment rises, other things being equal. This is because we assume the law of diminishing returns which states that as successive units of a variable factor (labour) are added to fixed units of a fixed factor (capital) the marginal product will eventually diminish.
The MPL curve multiplied by the marginal revenue that worker produces is the same as the labour demand curve, which shows the relationship between firms’ demand for labour and real wages, because demand for labour is derived from how much value workers produce (MRP = MPP x MR). Employers will demand more and more labour up to the point where the marginal revenue product (MRP) equals the real wage. The labour demand curve is therefore downward-sloping because of the declining productivity of labour (see Graph 1, D = MRP).
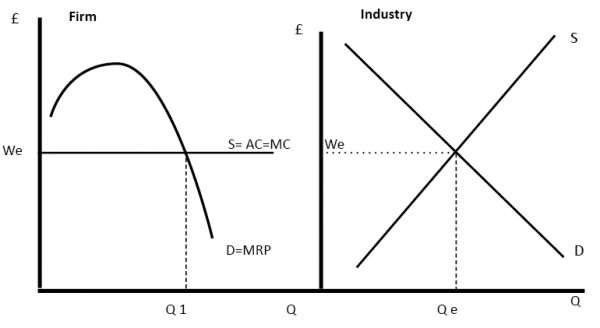
Graph 1: Labour demand curve
The Elasticity of Demand for Labour
Elasticity measures the responsiveness of a firm to a price change – in this case the wage rate.
A change in marginal productivity (i.e. the workers producing more or less of the products due to an increase efficiency) or marginal revenue (i.e. due to a change in the price received for the product) will cause a shift in the demand curve. For example, if marginal productivity of all workers rises, the derived demand for labour shifts outwards.
But the extent to which a change in the wage rate will affect the demand for workers depends on how steep the demand curve is – and the steepness is an indication of the elasticity of demand for labour. This curve measures how responsive firms are to altering the number of workers they employ, when the wage rate changes.
If there is minimal response, then demand is price inelastic and if the response is great, we say the demand is price elastic.
Elasticity of demand for labour = % change in demand for labour/ % change in wage rate
When the EoD for labour is > 1.0, then it is said to be elastic and if < 1.0 then inelastic.For example, if the EoD for labour is 3 (greater than 1, and so elastic) and wage rates increased by 10%, then all things being equal, the demand for labour would fall by 30% . Conversely, if demand for labour fell by only 2% when wage rates rose by 10%, then the EoD for labour would be 2/10 = 0.2. (inelastic because the value is less than one).
Factors affecting the Elasticity of Demand for labour
1.Time
– the longer the time period for adjustment, the easier it is to substitute labour for machinery. However, in the short term, a firm may have little choice but to employ the same number of workers even if wage rates increase rapidly.Therefore, demand for labour is more elastic in the long run when there is more time for the firm to re-arrange their working practices and production methods.
2. Availability of substitutes
– the harder it is to substitute workers for machinery, then the more inelastic the demand for labour. The easier it is,then the more elastic.
3. Proportion of labour costs to total costs
– if the wages represent only a small proportion of the total costs, then a rise in wage costs is less significant, and demand for workers will not change than much, (demand for labour will be inelastic). If wage costs make up a large proportion of total costs,t hen a rise in wages will have a dramatic effect on the number of workers the firm will employ and there will be a greater reduction in workers demanded, (demand for labour is elastic).
4. Price elasticity of demand for the product
– if the product being produced and sold is price inelastic, then any increases in wages can be passed onto the customer with minimal affect on consumer demand. In this case a wage rise is likely to have less effect on employment – the demand for labour is also likely to be inelastic. The opposite is also true: if the product is price elastic, then demand for labour will probably also be elastic. Remember that demand for labour is derived demand – derived from the demand for the product itself, and the elasticity of demand for the product.
Labour supply
The labour supply curve measures the number of workers willing to work at any particular wage. If we think in terms of individuals supplying labour, the shape of the curve depends on two things: the substitution effect and the income effect. The substitution effect concerns the individual’s choice between working and enjoying leisure time: as real wages rise from low levels, we give up leisure to work more, so the supply curve slopes upwards; but if real wages are already high and then rise more, we may feel that we can work fewer hours to meet our needs and take more time off – the income effect. Thus the individual’s labour supply curve is backward bending (Graph 2).

Graph 2: Individual labour supply curve
Above W2 the income effect outweighs the substitution effect – leisure is relatively attractive and we have to work fewer hours to maintain a target level of income. Below W2 the substitution effect outweighs the income effect – this worker is willing to substitute leisure for work – the higher the real wage, the more attractive it is to work (put another way, the opportunity cost of leisure, what you give up in terms of lost income, rises).
Where does equilibrium occur in the labour market? In the long run, for developed countries, Miles and Scott (2005) depict the labour supply curve as vertical (the income and substitution effects cancel each other out), indicating that the employment rate does not change over time: as the economy grows, higher demand for labour simply bids up the real wage to higher and higher levels (see Graph 3).
Although there will be variations over the business cycle, employment will always return to this full employment equilibrium. The unemployment rate at this position is known as the natural rate of unemployment. In the long run, according to this prediction, the aggregate supply curve for labour is perfectly inelastic.
Graph 3: Long-run model of the labour market
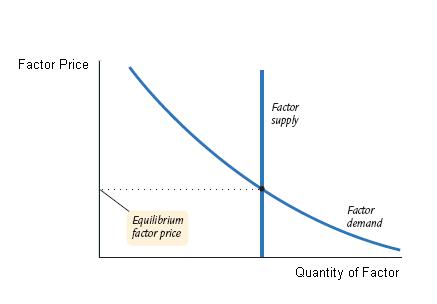
Source: Miles and Scott (2005).
This model is helpful for analysing labour markets in developed economies. It reflects the reality of relatively wealthy societies with few members of the labour force who are not formally employed (or self-employed in good conditions), with high wages/incomes. However, even in this context, things are not simple. The model may apply in the long run for the economy as a whole, but in the short run and for particular situations, there are a number of complexities. For instance:
- Competitive firms face a horizontal (perfectly elastic) supply curve for labour, because their demand is small in relation to the number of workers available.
- Whole industries (and large companies) face upward-sloping labour supply curves: they have to pay more to attract more workers.
- There may be a skills mismatch between demand for labour and the workers who are available, e.g. experienced vs. younger workers, skilled vs. unskilled.
- Supply is increased by immigration and labour mobility within the country. Immigration increases the supply of a productive factor of production – labour – and so potentially increases economic growth.
- There may be ‘unfair’ wage differentials (e.g. ones which do not reflect differences in the work done between men and women, residents and immigrants).
- Bargaining by trade unions may drive up the real wage (see Box 1).
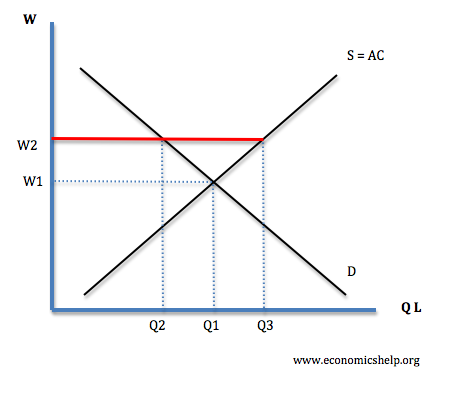
- Labour market restrictions (e.g. minimum wage legislation, or rules which make it difficult for firms to fire employees) may in theory increase unemployment (Graph 4) – although in practice there is little evidence that they do so.
- Over-generous unemployment benefits may reduce incentives to find jobs, thus keeping unemployment high and preventing downward pressure on wages.
Graph 4: The effect of the minimum wage in a competitive market
In Graph 4 the effect of the government imposing a minimum wage is to increase wages above the equilibrium wage (the wage which would apply in a perfectly competitive market). Employment at this point is Q2, and labour supply exceeds demand for labour by Q3Q2. The amount of existing employment which is lost is Q1Q2.
Box 1 Trade unions and wage bargainingTrade unions are organisations which represent groups of workers in a particular trade or industry. Their main objective is to improve wages and conditions for their members. Their representatives bargain with management. If successful, they will drive up the real wage. Neoclassical economists argue that this is bad for the economy and bad for workers – because although wages rise, unemployment also rises. Economic models show that this is true if we assume a perfectly competitive economy. Pushing wages above the equilibrium rate reduces employment. However, in an imperfectly competitive market where there are monopolies and oligopolies with considerable market power, employment and efficiency may actually be increased by trade unions bargaining for higher wages. Therefore, the outcome depends on the structure of the economy. Anderton (2000) |
Deregulation or intervention?
As in other areas of economics, the debate in relation to labour markets divides economists between those who would like to see maximum freedom for market forces, and those who believe that intelligent intervention is helpful. In the 1980s in the UK, the government of Margaret Thatcher succeeded in reducing the power of the trade unions and deregulating (freeing) the labour market. The result was lower unemployment, but increased inequality.
In France, where unemployment is still relatively high, a debate is currently raging between those who favour the UK reform route, and those who fear that such reforms would mean lower living standards for large numbers of workers. Government action to tackle some of the factors (like high payroll taxes) which prevent companies from expanding employment opportunities – may offer an alternative.
Zero Hour Contracts
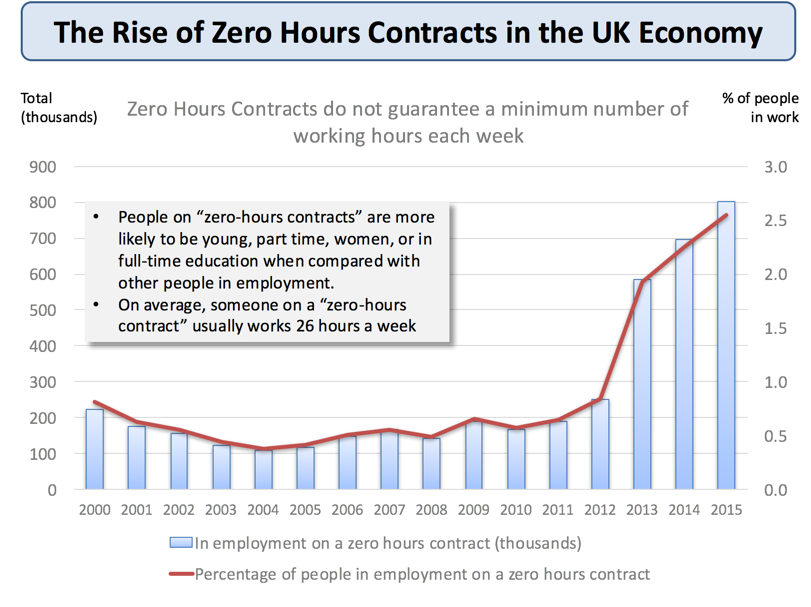
The bar chart below shows the rise in zero-hour contracts in the UK. These are contracts that stipulate no minimum hours worked and therefore present a least cost solution to firms. Their effect generally is to increase the elasticity of labour supply at the bottom end of the market. What about the demand for labour? Because the flexibility is an advantage to employers, the overall effect has been to shift the labour demand curve outwards – more people are employed at every wage because the employer can ensure that the productivity of labour is always at its highest level – if I only offer you four hours a week then we can assume you will work very hard for those four hours.
The bar chart show us that the number of zero hour contracts has risen by 450,000 between 2011 and 2015. In the hotel and food business, the proportion of workers on zero hour contracts is 11.2% – the highest of any sector.
 source:tutor2u
0 Comments