How to Measure Unemployment
9th September 2015
The Office of National Statistics (ONS) uses the Labour Force Survey to measure unemployment (along with employment and economic inactivity).
The unemployment figures use an internationally-agreed definition.
To count as unemployed, people have to say they are not working, are available for work and have either looked for work in the past four weeks or are waiting to start a new job they have already obtained. Someone who is out of work but doesn’t meet these criteria counts as “economically inactive”.
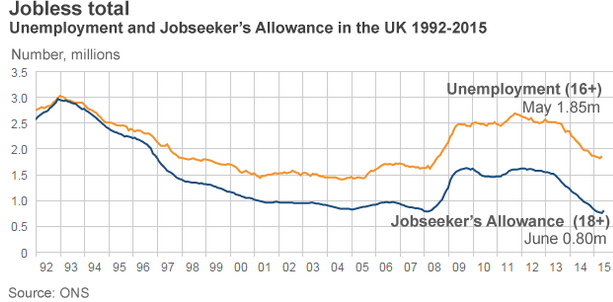
Each quarter the LFS covers 100,000 people in 40,000 households chosen randomly by postcode. That’s about one in 600 of the total population. In May 2015 this count stood at 1.85m (see fig 1 below).
The results are then weighted to give an estimate that reflects the entire population. Our survey has a very large sample size compared, for example, with opinion polls, which often sample around 1,000 people.
Even so, in any survey there is always a margin of uncertainty, in this case around plus or minus 3% for the unemployment level.
People sometimes ask why ONS doesn’t increase the sample size to give monthly figures.
Put simply, it’s a matter of resources. Surveys on this scale take a great deal of work. The cost of doing it on a monthly basis was estimated as at least £7 million a year back in the mid-1990s. So a rolling three-monthly survey remains the best solution for efficiently producing accurate yet manageable data.
Obviously it’s possible to look at the number of people unemployed, for example, in January-March and compare that with the February-April figure to see what the change is. But it wouldn’t be a good idea: the February and March data are in both sides of the comparison, so effectively you’re looking at January compared with April.
The other measure of joblessness – the claimant count – is published for each single month. It doesn’t suffer from the limitations of sample size and sampling frame, because it derives from the numbers of Jobseeker’s Allowance (JSA) claimants recorded by Jobcentre Plus, so a monthly figure is possible right down to local level.
But because many people who are out of work won’t be eligible for JSA, it’s a narrower measure than unemployment, typically about 1.5 million people recently, compared with about 2.5 million for unemployment.
And it’s not comparable with other countries’ data, unlike the LFS measures which use internationally agreed definitions.
So that leaves us with the three-month on previous three-month comparisons as the most robust and most complete measure of joblessness, which is why it’s the one that ONS uses for the headline figures in the monthly labour market statistical bulletins.
It might not be perfect, but it has clear advantages over the other ways we might do it. We believe the UK figures are as reliable as any produced internationally. And because so much of their strength lies in the sheer scale of our survey, we owe many thanks to all the people who freely give their time to take part.


0 Comments