Handout: Macroeconomic Objectives
28th September 2015
Macroeconomic Objectives
In this handout we introduce four key macroeconomic objectives, which we then explore in more detail throughout the website. Remembering macro core concept 1, the circular flow, the overall aim is to keep the circular flow of income generating positive overall economic growth. A key question remains: how much should the government interfere with natural economic cycles? The classical economic view is that we should leave growth to market forces. Keynesians disagree and advocate demand management. The debate, both political and economic, continues.
Introduction
The Government has four primary macroeconomic objectives, three concerned with the real economy (actual output or physical supply) and one concerning the monetary economy (prices and the money supply). It is an interesting question whether these objectives exist independently or as trade-offs – whereby you can have a little bit more of one (unemployment) for a less of something else (inflation). The four objectives will always be interlinked. The four fundamental objectives are:
- Stable growth of between 1.5% and 3% per year.
- Unemployment at the natural rate of around 5% of the active working population.
- Inflation of 2% per annum (neither more nor less).
- A sustainable Balance of Payments deficit. Not too large and not growing too fast.
Economic Growth (Gross Domestic Product)
Gross Domestic Product is defined as the total output of goods and services by an economy in a given period of time, usually one year. It can be measured through the addition of total income received by the factors of production, total output by the factors of production or total expenditure on the factors of production.
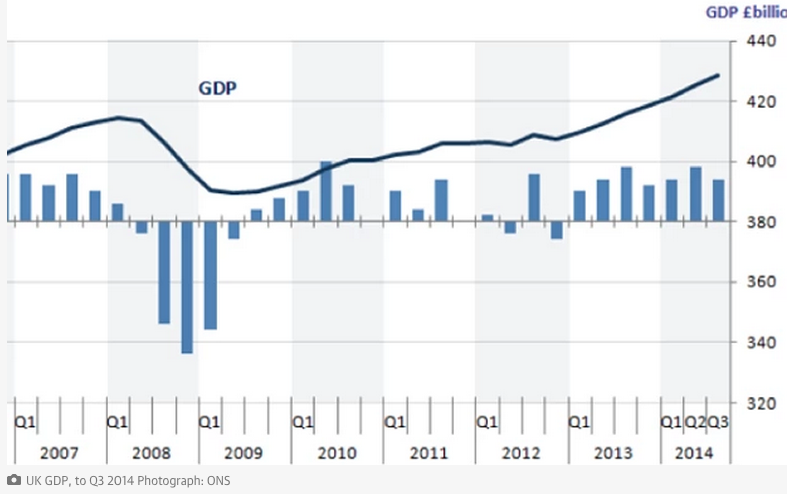
The objective of all governments is to achieve steady state growth – to eliminate as far as possible the cyclical fluctuations in GDP typified by periods of recovery (rising real GDP) and recession (falling real GDP0. The UK achieved this between 1992 and 2008, when the economy never deviated outside a growth band of 1.5 – 3.5% per annum. Notice that for developing economies like China this growth band is much higher – they seek growth rates above 9% and consider a rate of 7% a serious slowdown.
The 2007-8 banking crisis changed al that. It provoked a worldwide downturn in growth rates, so that for the UK, growth turned negative in 2008Q2 (-0.9%) and the downturn deepened to -2.1% in 2008Q4. Only in 2009Q3 did the UK return to positive growth. It was a short-lived, but sharp, cyclical downturn.
Benefits of Economic Growth
- Standard of Living Improves: This is usually measured by per-capita real income. If the economy is growing faster than the population then per-capita incomes are rising and the standard of living is said to be improving.
There are problems with this idea; mainly the belief that standard of living is more than a monetary factor. GDP ignores the distribution of wealth, infant mortality rates, urban sprawl, defensive expenditure and other factors such as the number of doctors per head or political freedom.
- Increased Tax Revenue: Greater economic growth could result in higher tax revenue allowing the government to increase spending on health, education or whatever else is seen to be a priority.
- Higher Employment: Economic growth can result in greater demand and therefore greater employment levels.
Costs of Economic Growth
- Inflation: Increases in demand, without a rise in supply can create demand-pull inflation (see AD2 and AD3 on LRAS1, causing a rise in average prices), or alternatively if wage pressures persist cost-push inflation may occur.
- Non-Renewable resources: The use of non-renewable resources to produce goods and services for use in the current time period means that these are unavailable in the future.
- Stress & Psychological problems: Professor Yew Nwang Ng has suggested that Economic Growth can create competitive pressures between families trying to outdo each other materially. This can result in, suicide, stress and depression.
- Environmental Costs: As the economy grows, and output increases, manufacturing firms may increase pollution, resulting in a decline in the ozone layer for example. As living standards rise, the number of cars, or other consumables rises, further increasing pollution and also the need for landfill sites to deal with rubbish.
- Structural Unemployment: As an economy grows its structure changes and demand for certain skills decreases, resulting in structural unemployment.
Policies to create Economic Growth
To increase economic growth a government needs to undertake policies that will raise aggregate demand (C+I+G+(X-M)) or Aggregate Supply.
-
Demand Management
Demand management aims to shift aggregate demand to the right or left (expansionary or contractionary) through its effect on one of the items of aggregate expenditure (AD = C + I + G + (X-M), see core macro concept 2). See diagram. If the economy runs up against supply constraints, this can geenrate inflation (prices rise on the y axis).
-
- Fiscal Policy: The manipulation of taxes and government spending to achieve government macro-economic
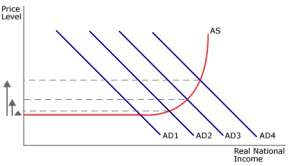
Aggregate demand shifts to the right as governments try to ‘fine tune’ the economy by fiscal or monetary policy
objectives. To raise AD and growth the government must lower taxes and/or raise government spending (see shift in AD on the diagram below). This will act to raise C, I and G and raise AD by more than the rise in spending (C, I or G) because of the multiplier.
- Monetary Policy: The manipulation of money supply, interest rates and exchange rates to achieve macro-economic objectives. The tools are interdependent, the manipulation of one of these will have an effect on the other tools. So to raise AD the government may decide to raise the money supply, and so lower interest rates and depreciating the currency. The combined effect of this is to raise C and I, but also to raise X and lower M. This will be the same as any policy, which acts to reduce interest rates or depreciate the currency. This can be seen on the diagram below as a shift in the AD from AD1 to AD3.
- Fiscal Policy: The manipulation of taxes and government spending to achieve government macro-economic
-
Supply Side Policies
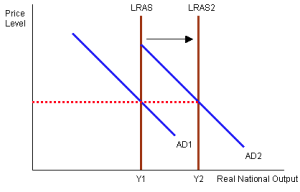
There are a number of policies which can raise Aggregate Supply, and thus raise Economic growth. Say’s law states that ‘Supply creates its own demand’. Supply side policies seek to raise supply, productivity and remove other obstacles to incentives to work, to take risks, and to lend for investment, thus shifting the Long-run Aggregate Supply curve to LRAS2 . The improvement in productivity leads to higher wages as companies can afford to increase workers’ pay. Higher pay boosts aggregate demand through its effect on consumer spending (C).
Supply Side Policies
| 1. Reduce Trade-Union Power | 2. Reduce State Benefit |
| 3. Reduce Minimum Wage | 4. Reduce Income Tax |
| 5. Encourage Mobility of Capital through Enterprise Zones and Tax Incentives | 6. Raise Mobility of Labour through the provision of information |
| 7. Reduce Corporation Tax | 8. Education & Training |
| 9. Encourage Share Ownership | 10. Encourage Performance Related Pay creating incentives to work. |
| 11. Encourage Research & Development |
Balance Of Payments
Definition
The BOP is a record of all monetary payments between one country and the rest of the world over a period of time.
Measurement
The balance of payments account is split into two sections. You need to be mostly concerned with the Current account, but it is an eternal economic truth worth learning that the Balance of Payments always balances – the addition of capital and current account balances must add to zero.
Current Account
This includes:
- Trade in goods: e.g. export of medicine to South Africa [ + or credit] whilst import of food from France [ – or debit].
- Trade in Services: e.g. export of insurance and other financial services, tourism into the UK are credits whilst purchase of a USA television programme would be a debit.
- Income from Investments: interest, profits and dividends (IPD) from overseas assets such as bank deposits, UK owned companies overseas, shares quoted on foreign stock markets but held by UK residents (less IPD earned in the UK by foreign held assets).
- Current transfers eg UK contribution to EU; aid to developing countries. In this category, no goods or service is being exchanged, just a flow of money.
The overall position on this account is called the Current balance. A deficit on this account may be a symptom of poor economic performance.
Causes of a Current Account deficit
- High levels of income in the domestic economy. Imports tend to have a high income elasticity of demand so that, in a
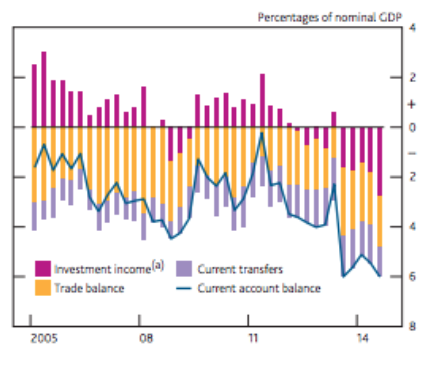
Here the Balance of Payments is expressed as a % of GDP. Note the rising deficit on current account. Source: BEQB
boom, imports are ‘sucked’ into the economy. The UK has a high marginal propensity to import (MPM), therefore economic growth usually results in greater demand for imports.
- An overvalued exchange rate which makes exports less price competitive and imports more price competitive.
- High labour costs per unit of output (perhaps a reflection of low investment in capital and labour in the past) means that average production costs may be higher than our competitors, again making UK goods seem less price competitive.
- Poor non price competitiveness of UK goods in terms of quality, design, reliability, delivery times, after sales service may mean the ‘taste’ for UK goods is low.
- Longer term, it may be a failure of the economy to move resources into areas of comparative advantage; weak investment levels.
However, the current deficit is not such a problem if:
- it is only short term
- the deficit is made up of raw materials which will be converted into final goods for export.
- It can be financed without requiring high interest rates to attract capital inflows from abroad.
Policies to remove the Current Account deficit
- Apply fiscal (increase in taxation) and monetary policy (higher interest rates) to reduce AD. If spending is, in general, cut back there will be less spending on imports (eg wine from France, cars from Germany, clothes from China). Such a policy would be unpopular because spending on home produced goods would also be cut back, causing unemployment at home.
- Remove the overvaluation of the exchange rate. This can be attempted by lowering interest rates to bring down the value of the £. This reduces capital inflows on capital account (foreigners buying UK bonds which are now less attractive).The depreciation (in a floating exchange rate system) or devaluation (in a fixed rate system) makes exports more price competitive and imports less so. The problem is that lower interest rates increase AD at home which may cause inflationary pressure. China devalued the yuan twice in 2015 (August 2015, the second time, to 6.42 yuan to the $). On September 16th 1992, Black Wednesday, Britain exited the exchange rate mechanism, a precursor to the euro, as it was unable to maintain the fixed exchange rate, leading to an effective devaluation of sterling of 7%. UK interest rates touched 15% in n attempt to attract capital inflows to defend this overvalued rate.
Some economists therefore advocate higher taxation (method 1) with lower interest rates (method 2)
- The problem here is that 60% of the UK’s trade is with the EU and such a policy would not be allowed.
- Increase competitiveness by applying Supply Side policies – this is the policy favoured by the UK government.
Capital Account
The capital account records net flows of financial capital. Note this includes financial assets such as purchases of government bonds (gilt-edged stock) and Treasury Bills, investment flows and speculative currency transactions.
On any day most money flows between countries are financial investment; this can be short term (opening foreign bank accounts for speculative purchases of foreign currency), medium to long term (foreign shares) and long term (buying foreign companies). The financial account records the purchase and sale of these assets and any government use of the official reserves to buy and sell other currencies.
However, the income earned on these assets (interest, profits and dividends, or IPD) each year is recorded in the Current Account (income from Investment)
Overall Balance of Payments Account
The sum of these three accounts equals zero. This means that a current account deficit is matched by an overall surplus on the capital and financial account.
To see why this is true, imagine I buy a new BMW direct from Germany (current account inflow). To get the suros I need I will have to give up £ (sterling) and purchase Euros (capital account outflow). So the purchase of the BMW has two equal but offsetting entries in the BOP accounts.
Inflation
Definition
Inflation is defined as a sustained rise in the general price level. It is generally measured in percentage terms. The Monetary Policy Committee of the Bank of England aims for an inflation target of 2% ± 1% using the CPI.
Measurement
Retail Price Index
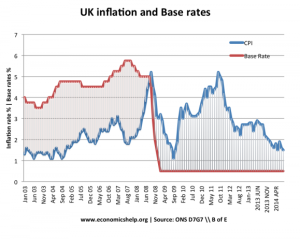
UK inflation has fallen below the Chancellor’s target of 2% per annum. Base rates remain at an all time low of 0.5%. Source economicshelp.org
The RPI is a weighted index, based on the spending decisions of 6785 households (taken from across regions and income levels) surveyed via the Expenditure & Food Survey. Weights are allocated to the top 650 goods, with the weight determined by the amount spent on that good, such that goods taking up a large proportion of income have a larger impact on the RPI. 150,000 price estimates are then taken, with the average price for each good being used in the index.
The top 4% of income earners and low-income pensioners (reliant on the state pension) are excluded from the survey, since they are likely to have a distorting impact.
Problems with the RPI
- Quality of output is ignored; price changes may reflect improved quality rather than an increased price level.
- Special offer are ignored, such that prices used are, on average, over-estimates.
- The weightings are changed annually, although spending patterns are more variable than this; so, the weightings used are unlikely to be fully accurate.
- Due to the limited number of households surveyed, there is potential for sampling error.
- It is not the same measure used abroad, making international comparison difficult.
Alternative Measures of Inflation
- RPIX (Underlying or Target Rate of Inflation) – RPI, excluding mortgage interest payments.
- RPIY – RPIX excluding local authority and indirect taxes.
- Consumer price Index (CPI): This measure excludes a number of items that are included in RPI, mainly related to housing. These include council tax and a range of owner-occupier housing costs such as mortgage interest payments, house depreciation, buildings insurance, estate agents’ and conveyancing fees.
The CPI covers all households, while the RPI excludes the top 4% of income earners. The CPI also includes university accommodation and foreign students’ university tuition fees.
Costs of Inflation
Costs of Anticipated Inflation
- Menu Costs – Prices become out of date and need to be updated; the costs of doing so are menu costs. This would include the costs of reprinting catalogues/menus, updating vending machines etc.
- Shoe Leather Costs – As inflation increases, the opportunity cost of holding cash increases. People will hold more money in interest-bearing accounts, and more trips to the bank will become necessary.
Costs of Unanticipated Inflation
- Confusion of Market Mechanism – Consumer sovereignty relies on producers responding to changes in prices. Inflation means that producers may believe that demand for their good has risen (and hence increase production) when, in fact, only the general price level has increased. As a result, scarce resources may not be allocated in the most efficient way.
- Uncertainty – Inflation creates uncertainty, particularly amongst the business community and when inflation fluctuates, firms cannot predict costs and revenues and may be deterred from investment projects.
- Redistributional Costs – Income is distributed, away from those on fixed incomes and those in a weak bargaining position (e.g. pensioners), to those who can use their economic power to gain large increases in income. Furthermore, borrowers benefit as the real value of debt is eroded; savers lose out.
- International Costs – Exports lose their competitiveness, whilst imports become relatively cheaper. The trade position will therefore deteriorate, unless the exchange rate deteriorates to compensate, other countries have higher inflation, or exports do not sell on the basis of price alone.
Causes of Inflation
There are two main causes of inflation.
- Demand-pull inflation – This occurs when AD increases (due to greater consumption, investment, government spending or net exports), pushing against the limits imposed by the AS curve at full employment. In the diagram (left), as AD shifts from AD to AD1, the price level rises to p2.
- Cost-push inflation – This is when costs of production increase (for example due to high wage demands or a weakening exchange rate which makes imported raw materials more expensive), and are then passed on to consumers in the form of higher prices. In the diagram (right), this is shown by a shift to the left in the AS curve, which sees prices rise to p2.
Policies to address inflation
In order to deal with (or prevent) demand-pull inflation, governments can use either demand-side or supply-side policies. Demand-side policies will require restrictive fiscal policy (i.e. reduced government spending and/or higher taxes) or restrictive monetary policy (i.e. higher interest rates to curtail consumption, investment and net exports), and will see the AD curve shift back to the left.
However, so as to prevent excessive dampening of economic growth, the government will need to pursue supply-side policies to control inflation into the long-term. These policies see an improvement in the quantity/quality of factors of production, and a rightward shift in the AS curve reflecting increased productive potential. Consequently, the inflationary pressures imposed by expanding AD are relieved.
Policies to deal with cost-push inflation need to control the cost of factors of production to firms. In theory, price controls and incomes policies (ie. setting limits to wage increases) can be used although these are unpopular and distort the market mechanism. Governments can cut taxes imposed on firms, although there are clear limits to this policy, and it may serve to stimulate demand, and hence demand-pull inflation.
Unemployment
Achieving a low level of unemployment is one of the government’s macroeconomic objectives. Unemployment harms individuals and the economy. Labour is a factor of production and unused factors imply a lower growth rate than is achievable. the economy will be inside its PPF if unemployed resources exist.
Definition of unemployment
If you are between the ages of 16-64 (16-59 for women) you are of ‘working age’. However, being of working age does not necessarily mean that you are employed or wanting employment. The following people are of working age but are not seeking employment.
- Students
- Those in early retirement
- Housewives
Such people are economically inactive and thus they do not form part of the working population, which is defined as:
‘The proportion of the population that is either in work or seeking work’
It is sometimes defined as the labour force. If you are part of the labour force, but not working, you are defined as unemployed.
A person is unemployed if they are out of work and seeking work
Measuring unemployment
The UK government uses two measures to look at unemployment. The figures can be expressed as a percentage of the labour force or as an absolute number of unemployed (sometimes figures-for employment are used).
The Claimant Count
This simply counts the number of people who are claiming unemployment benefit (known as the Job Seekers Allowance). This was the measure used by the Conservative government.
Advantages of the Claimant Count
- It uses information that is already being compiled and thus it is cheap and easy to put together.
Disadvantages of the Claimant Count
- It is open to political manipulation. The Conservative government made 30 changes to the benefit system, of which 29 made it harder to claim the benefit, thus ‘reducing’ the level of unemployment.
- Many seemingly unemployed people are not counted. e.g. people under 18 and married women who would accept a job but are not allowed to claim because their husbands earn too much
- The measurement is not internationally recognised and thus we cannot compare our rate of unemployment to that of other countries.
International Labour Organisation
Every three months a Labour Force Survey is carried out on 60,000 households. It registers the number of people who are available for work in the next two weeks, are without a paid job, and have looked for work within the last four weeks. As the ILO measure is more inclusive than Claimant Count it will usually be greater than the Claimant Count measure of unemployment.
Advantages of the ILO
- It is a far more inclusive method that should be more representative of the true figures of unemployment.
- It is internationally used.
Disadvantages of the ILO
- It is very expensive to compile.
- By using only survey data it is open to errors.
General measurement problems
Both methods will suffer from untruthful responses, i.e. people who are working but still claiming benefits and those who lie when being surveyed.
Both methods suffer from the problem of not knowing how to characterise the disabled. Some ‘unemployed’ people may actually be ‘unemployable’ due to. heavy disability – should they be included or not?
The Costs of unemployment
To the Individual
- Loss of earnings means a lower standard of living
- The unemployed tend to feel useless and not a part of society. This can lead to depression.
- An unemployed person loses work skills, thus decreasing their chances of becoming employed again.
To the Economy
- There is lost tax revenue to the government.
- The government has to spend more on benefits.
- Areas of high unemployment tend to suffer from increased crime, violence and vandalism.
- There is an opportunity cost as output is reduced.

0 Comments