Summary: Economic Growth, AD and AS
7th September 2015
Economic Growth
Economic growth refers to an increase in the amount that a country is able to produce. An economy grows for a variety of reasons
- More people → labour force increases ↑
- More investment → factories and machines ↑
- Quality of productive resources is also important – Improvement in quality → output ↑.
Improvements in training mean that the labour force will become more productive
Economic growth – is measured by the change in GDP and may be shown as a total figure or in per capita terms
Aggregate supply
The aggregate supply curve of an economy shows much will be produced at any given price. It can be used to show how much an economy is producing
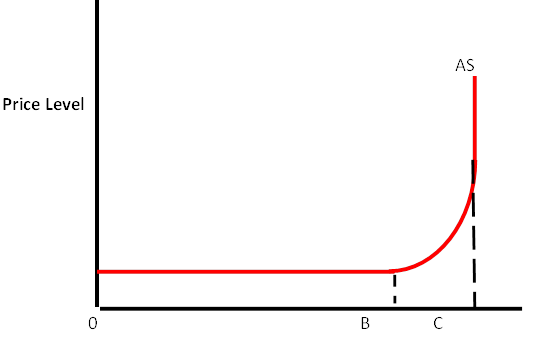
The diagram shows a possible aggregate supply curve. At an output level of OC, the aggregate supply curve is vertical. This is because OC, the aggregate supply curve is also the level of full capacity – this is when no factor of production – land, labour and capital- is unemployed. If all factors of production are fully employed, then it is impossible to increase aggregate supply.
The diagram shows a possible aggregate supply curve. At an output level of OC, the aggregate supply curve is vertical. This is because OC, the aggregate supply curve is also the level of full capacity – this is when no factor of production – land, labour and capital- is unemployed. If all factors of production are fully employed, then it is impossible to increase aggregate supply.
It is possible for an economy to reach a point where it cannot grow anymore but still have unemployment. This may be due to occupational and geographical immobility
If an economy is below full capacity, then an increase in output is possible. Between output levels OB and OC, it is assumed that firms can only increase output by also raising their prices. Raising output will mean that firms have to
- take on more workers,
- increase their demand for raw materials,
- expand their premises
- buy more machinery
Increases in factor costs will force firms to put up prices – inflation
Inflation is a sustained rise in prices which is measured by the RPI
Aggregate Demand
In a market, the quantity bought and sold is determined by the forces of demand and supply. The economy is made up of a number of different markets.
Equilibrium occurs where total or Aggregate Demand = total or Aggregate Supply
Four main items of expenditure
- households spend money on consumption (C)
- private spends money on investment (I)
- government expenditure (G)
- exports (X) add to domestic demand
Some goods are bought from abroad – payments abroad are not included in national income calculations, imports (m) are deducted.
AD = C + I + G + X – M
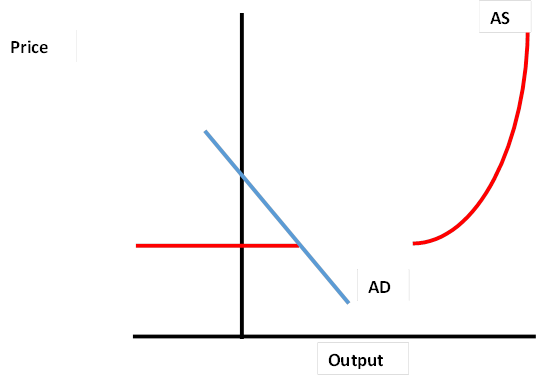
AD curve shows the relationship between price level and demand
A rise in price means that consumers need more money in order to buy the same number of goods as before.
AD curve is downward sloping. A rise in the price level will lead to a fall in consumption, investment and exports, while imports may increase.


0 Comments