Fiscal Targets 2015
5th October 2015
source OBS July 2015
Performance against the Government’s fiscal targets
 1.37 The Charter for Budget Responsibility requires the OBR to judge whether the Government has a greater than 50 per cent chance of hitting its fiscal targets under existing policy. The current version of the Charter (updated by the Coalition Government in December 2014 and available on our website) sets out three targets formally in place for this forecast:
• the fiscal mandate: “a forward-looking aim to achieve cyclically adjusted current balance by the end of the third year of the rolling, 5-year forecast period”. For the purposes of this forecast, the third year of the forecast period is 2018-19;
• the supplementary target: “an aim for public sector net debt as a percentage of GDP to be falling in 2016-17”; and
• the welfare cap: a ceiling on cash spending on a subset of social security benefits and tax credits “at a level set out by the Treasury in the most recently published Budget report, over the rolling 5-year forecast period.”
We assess performance against the cap formally at each Autumn Statement and monitor progress in our Budget forecasts.
1.38 But alongside the Budget the new Government has now published a revised draft Charter that will be laid before Parliament for approval ahead of our next fiscal forecast. This would:
• replace the current fiscal mandate with “a target for a surplus on public sector net borrowing by the end of 2019-20”. Once a headline surplus has been achieved the mandate will require “a target for a surplus on public sector net borrowing in each subsequent year”. (The draft Charter further specifies that “these targets apply unless and until the OBR assess that there is a significant negative shock to the UK. A significant negative shock is defined as real GDP growth of less than 1 per cent on a rolling 4 quarter-on-4 quarter basis”); and
• replace the supplementary target with “a target for public sector net debt as a percentage of GDP to be falling in each year” to 2019-20.
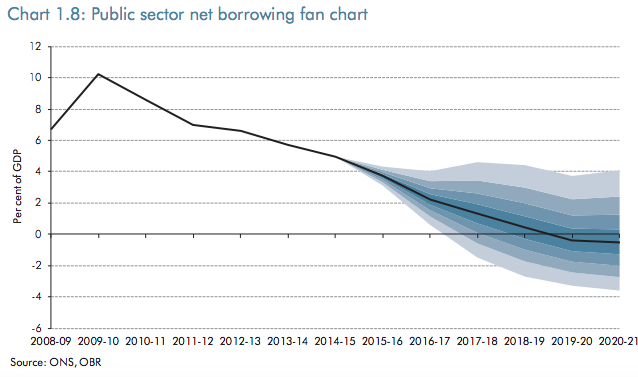
1.39 On the basis of our central forecast, we judge that the Government has a greater than 50 per cent chance of meeting both the current and proposed fiscal mandates. We estimate that the cyclically adjusted current balance will move from a deficit of 2.4 per cent of GDP in 2014-15 to a surplus of 1.1 per cent in the mandate year of 2018-19. It is also forecast to be in surplus by 0.3 per cent of GDP in 2017-18, thereby meeting the mandate as it applied in our March forecast – but by a significantly smaller margin than the Government was comfortable with then. Our central forecast also shows a PSNB surplus of £10.0 billion (0.4 per cent of GDP) in 2019-20, meeting the proposed fiscal mandate.
1.40 In terms of the current and proposed supplementary debt targets, our central forecast shows debt falling as a share of GDP in every year of the forecast, thereby meeting both. Debt falls as a share of GDP in 2015-16 thanks only to the significant financial asset sales that are Economic and fiscal outlook 20 Executive summary planned during the year. It falls more comfortably thereafter because the primary budget balance is stronger by then. These conclusions are unchanged from March.
1.41 The Government has reset the level of spending permitted under the welfare cap in this Budget, as the Charter requires it to do at the start of each Parliament. The new cap is significantly lower than the old, by 13 per cent in 2019-20. This reflects the Government’s decision to lock in the savings from the package of working-age welfare spending cuts that it has announced in the Budget, which reach £12.5 billion in our forecast by 2019-20. The largest of those cuts are focused on reducing the generosity of tax credits and working-age benefits, by freezing most in cash terms for four years, by changing maximum entitlements and withdrawal rates in tax credits and universal credit, and by forcing social sector landlords to cut the rents that are subsidised through housing benefit.
1.42 All forecasts are subject to significant uncertainty. Chart 1.8 shows our median forecast for PSNB – the fiscal aggregate that is targeted in the proposed fiscal mandate. Successive pairs of shaded areas around the median forecast represent 20 per cent probability bands. As in Chart 1.2 above, the bands show the probability of different outcomes if past official errors were a reasonable guide to future forecast errors.

0 Comments