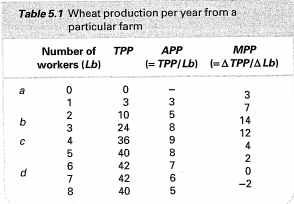
Activity: Plot the AP, MP and TP curves
11th September 2015
Marginality is one of our core concepts (core concept 4). This is because economic decisions are taken at the margin – when one variable changes a small amount. One relationship is given in this table – between marginal average and total product. Average product is what we elsewhere call ‘productivity’ or output per head. Marginal product (MPP – sometimes written marginal physical product) is the amount the last worker contributes to production or output. This is a logical (mathematical) relationship: when marginal product declines the slope of the total product curve must be declining (plot this for yourself and you will see it). Also where marginal product is zero total production must be at its greatest – the next worker gets in someone’s way, so the logic goes, and so the output of everyone added up falls. There is also a relationship between average product and marginal product which is worth thinking over.


0 Comments