Some inequality is needed to propel growth, economists reckon. Without the carrot of large financial rewards, risky entrepreneurship and innovation would grind to a halt. In 1975 Arthur Okun, an American economist, argued that societies cannot have both perfect equality and perfect efficiency and must choose how much of one to sacrifice for the other.
While most economists continue to hold that view, the recent rise in inequality has prompted a new look at its economic costs. Inequality could impair growth if those with low incomes suffer poor health and low productivity as a result. It could threaten public confidence in growth-boosting policies like free trade, reckons Dani Rodrik, of the Institute for Advanced Study, in Princeton. Or it could sow the seeds of crisis. In a 2010 book Raghuram Rajan, now governor of the Reserve Bank of India, argued that governments often respond to inequality by easing the flow of credit to poorer households. When the borrowing binge ends everyone suffers.
Pinning down the precise relationship between growth and inequality is a challenge. Some studies reckon inequality is mildly bad for growth. Others suggest the relationship changes as poor countries grow rich, while still others reckon it is the trend in inequality rather than its level that matters.
Pinning down the precise relationship between growth and inequality is a challenge. Some studies reckon inequality is mildly bad for growth. Others suggest the relationship changes as poor countries grow rich, while still others reckon it is the trend in inequality rather than its level that matters.
Research by economists at the International Monetary Fund aims to add clarity to the debate. In a 2011 paper Andrew Berg and Jonathan Ostry argued that it is the duration of spells of growth that is most important for long-run economic performance: getting an economy growing in the first place is much easier than keeping the growth spell rolling. They reckon that when growth falters, inequality is often a culprit. Latin America’s Gini index is about 50, well above that in emerging Asia, which has a Gini of about 40. (A Gini index is a measure of income concentration that ranges from 0, representing perfect equality to 100, where all income flows to a single person.) Were Latin America to close half of that gap in inequality, its typical growth spurt might last twice as long, on average.

Others reckon that it may not be inequality itself that harms growth but rather governments that tax and spend to try to reduce it. In a new paper Messrs Berg and Ostry and Charalambos Tsangarides tease out the separate effects of inequality and redistribution. They turn to a data set put together by Frederick Solt, a political scientist at the University of Iowa, containing Gini indices for 173 economies spanning a period of five decades.
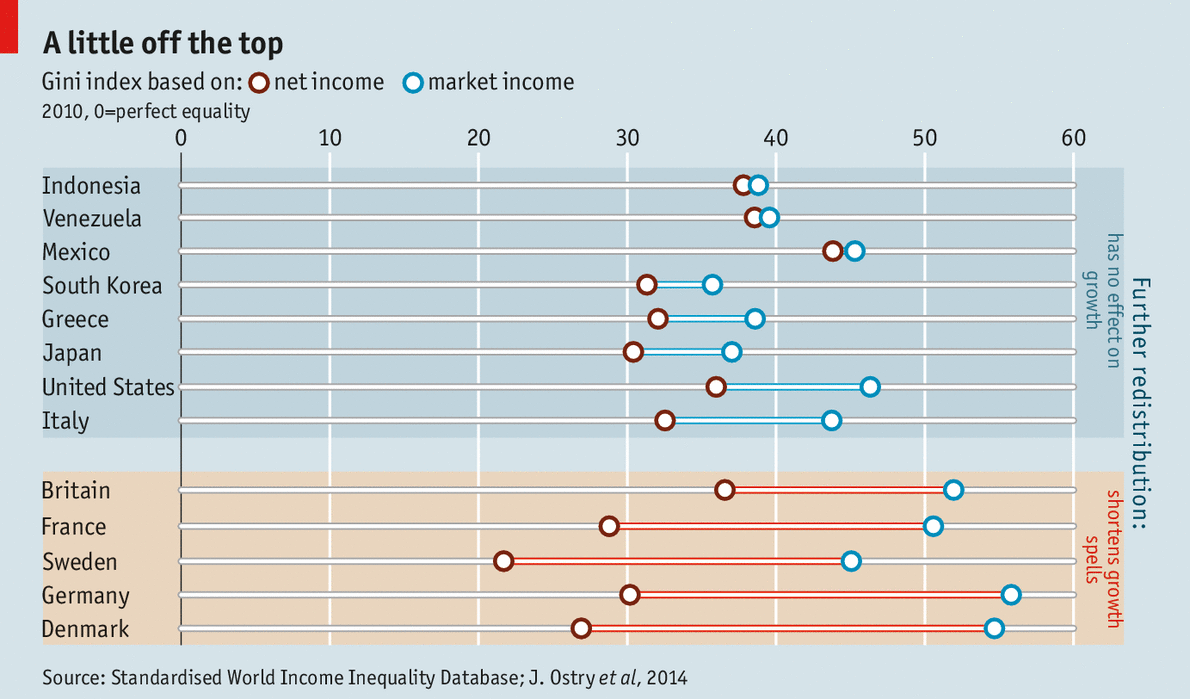
Mr Solt provides Ginis for both market income and net income (after taxes and transfers). The difference between the two gives the authors a measure of redistribution (see chart). In America, which does relatively little of it, redistribution trims the Gini index by roughly ten points. In Sweden, in contrast, it cuts the Gini by 23 points—more than half. Using these figures, the economists can separate out the different effects of redistribution and inequality on growth.
Redistributing prejudice
The authors find that governments in more unequal countries redistribute more, and rich economies do more than poor ones. As a result, differences in inequality across rich countries are mostly down to the generosity of redistribution; Germany is more unequal than Britain before redistribution but much less so after.
Up to a point, spreading the wealth around carries no growth penalty: growth in income per person is not meaningfully lower in countries with more redistribution. But economies that redistribute a lot may enjoy shorter growth spells, the authors reckon. When the gap between the market and net Ginis is 13 points or more (as in much of western Europe) further redistribution shrinks the typical expansion. The authors caution against drawing hasty conclusions. Details surely matter; nationalising firms and doling out profits would presumably be worse for growth than taxing property to fund education.
Inequality is more closely correlated with low growth. A high Gini for net income, after redistribution, corresponds to slower growth in income per person. A rise of 5 Gini points (moving from the level in America to that in Gabon, for instance) knocks half a percentage point off average annual growth. And holding redistribution constant, a one-point rise in the Gini raises the risk an expansion ends in a given year by six percentage points. Redistribution that reduces inequality might therefore boost growth.
If redistribution is benign, that could be because it substitutes for shaky borrowing. In their 2011 paper Messrs Berg and Ostry note that more unequal societies do poorly on social indicators such as educational attainment, even after controlling for income levels. This suggests that households with lower incomes struggle to finance investments in education. In a recent paper Barry Cynamon of the Federal Reserve Bank of St Louis and Steven Fazzari of Washington University in St Louis reckon most Americans borrowed heavily before 2008 to prop up their consumption. That kept the economy growing—until crisis struck. Sensible redistribution could mean the difference between a healthy growth rate and one that is decidedly subprime.
Sources
“Inequality and unsustainable growth: Two sides of the same coin?“, Andrew Berg and Jonathan Ostry, IMF Staff Discussion Note, April 2011.
“Redistribution, inequality, and growth“, Andrew Berg, Jonathan Ostry, and Charalambos Tsangarides, IMF Staff Discussion Note, February 2014.
“Inequality, the Great Recession, and slow recovery“, Barry Cynamon and Steven Fazzari, January 2014.
Correction: This article originally mis-stated Dani Rodrik’s affiliation as Princeton University, rather than the Institute of Advanced Studies, which is in Princeton but is not part of the university. This was corrected on March 3rd.

0 Comments